Diagnose & Fix Painfully Slow Ollama: 4 Essential Debugging Techniques + Fixes
Frustrated with laggy Ollama? Try out these debugging techniques

Nowadays, more people have started using local LLMs and are actively utilizing them for day-to-day tasks.
However, the more use cases you run on a local LLM, you may start noticing some performance issues.
Instead of directly blaming your hardware, you can perform some basic checks to get the best performance out of your system.
Start with the Basics: Is Heat Killing Your Ollama Speed?
Okay, let's start simple - if you're on NVIDIA GPU (most common for Ollama), open a second terminal and run this while Ollama generates text:
nvidia-smi -l 1
The -l 1 refreshes every second so you see live changes.
When the system is idle, you might see something like this:
Here’s what you should pay attention to:
- A temperature around 52°C means the GPU is cool and doing fine
- P8 indicates a low-power, almost idle state
- 355MiB out of 4096MiB memory usage means there’s plenty of VRAM available
- 13% GPU utilization shows the GPU isn’t under much load
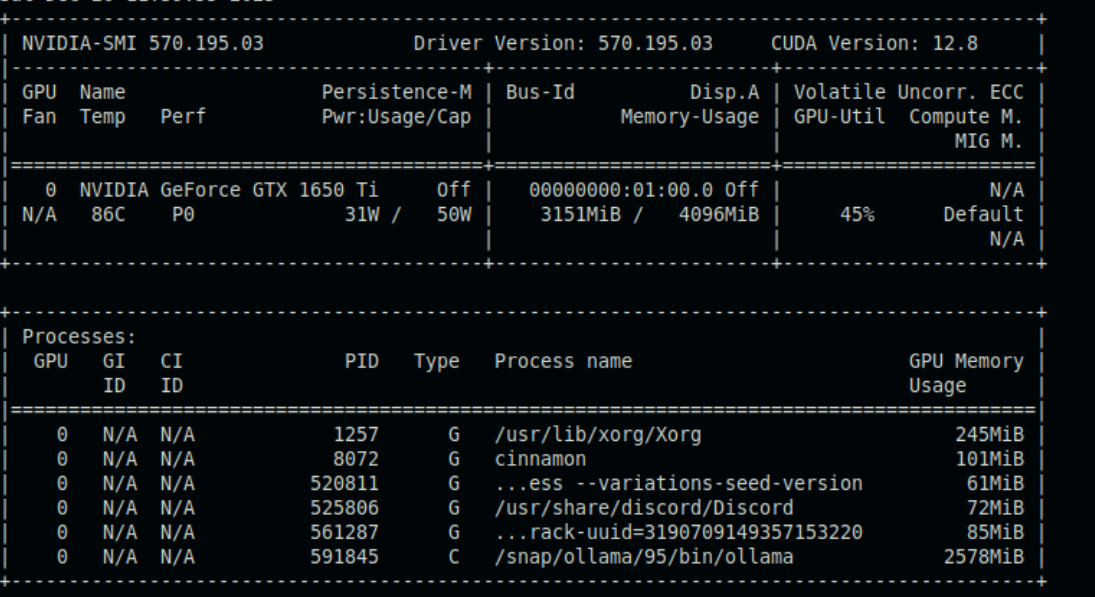
Now let’s put some pressure on it. In the worst case, you might see something like this:
-
Temp: 86°C – Danger zone. NVIDIA laptops usually start throttling around ~85–87°C to protect the hardware
-
Perf: P0 – Maximum performance state (which is good), but combined with high temperature, clock speeds get pulled back
-
Pwr: 42W/30W – Drawing more than the power cap, so it’s both power-limited and thermally limited
-
GPU-Util: 100% – Working hard, but tokens/sec feels slow because clocks have dropped
-
Memory: Nearly full – VRAM pressure can add extra slowdown due to swapping
Once your GPU hits around 85°C, the firmware steps in, decides it’s too hot, and reduces clock speeds. You still see 100% utilization (the GPU is trying), but the actual compute speed drops sharply. As a result, tokens/sec can fall from 35 to 12, even though nvidia-smi still looks “busy.”
What does these Perf states mean?
| Perf State | Meaning | What it tells you |
|---|---|---|
| P0 | Highest performance mode | GPU is allowed to run at full speed |
| P2 | High performance | Slightly reduced, still strong |
| P5 | Medium performance | Balanced / light workload |
| P8 | Idle / low power | GPU is mostly resting |
Lower numbers mean higher performance.
So P0 is fast, P8 is idle — but even in P0, heat and power limits can still slow things down.
Fixes you can try
- Use a cooling pad – Can drop temperatures by 5–8°C almost immediately
- Elevate the laptop – Raise the back by 1–2 inches to improve airflow
Target zone: Keep temperatures between 75–82°C with less than 85% VRAM usage. In this range, performance is generally smooth and stable.
Dive Into the Model: Check and Understand Its Quantization
Another thing worth checking is whether your model is quantized to the right level.
At a high level, an LLM is just a huge collection of numbers called weights. These numbers decide how the model thinks and generates text. The number of bits tells the computer how precisely each of those numbers is stored.
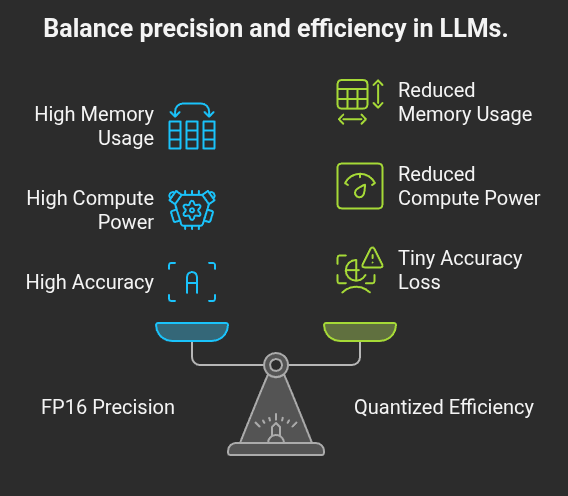
By default, LLMs store weights in FP16, which means 16 bits are used for every number. This gives very high precision, but it also uses a lot of memory and compute power.
Quantization reduces this precision by storing those numbers using fewer bits. The model becomes smaller and faster, at the cost of a tiny loss in accuracy.
- FP16 → 16 bits (original size)
- Q8_0 → 8 bits
- Q4_K_M → 4 bits (sweet spot)
- Q2_K → 2 bits
You can usually see the quantization level directly in the model name. For example, in Ollama:
llama3:8b-q4_K_M    ← 8B params, Q4_K_M quant
mistral:7b-q8_0     ← 7B params, Q8_0 quant
gemma2:9b           ← 9B params, default FP16
The table below makes the trade-offs easier to understand:
| Format | Bits | VRAM | Quality | Best For |
|---|---|---|---|---|
| Q4_K_M | 4 | Low | Great | Most users |
| Q5_K_M | 5 | Medium | Excellent | Quality focus |
| Q8_0 | 8 | High | Near-perfect | Precision tasks |
| FP16 | 16 | Highest | Original | Big GPUs only |
Anything cachable? Utilize KV Caches effectively
If you’re sending many requests to Ollama, especially when those requests are similar or share a common prompt, you can take advantage of KV caching to speed things up significantly.
LLMs generate text one token at a time. For every new token, the model needs to look back at all the previous tokens using something called attention. If nothing is cached, the model ends up redoing the same work again and again.
KV caching avoids this repeated work by storing intermediate results and reusing them.
What is KV Caching?
KV caching (short for Key–Value caching) is an optimization used in transformer-based models. Its main goal is simple: make text generation faster.
The problem KV caching solves:
When an LLM generates text, it does this step by step. At each step:
- It looks at all previous tokens
- It runs attention over them
- It decides what the next token should be
Without caching, this attention computation is repeated from scratch every time, even if most of the prompt hasn’t changed.
With KV Caching:
With KV caching enabled:
- The model stores (“caches”) the key and value vectors for tokens it has already processed
- When a new token is generated, only the new token’s computations are done
- All previous computations are reused from the cache
- This makes each generation step much faster, especially for long or repeated prompts.
Example
Below is an example of an Ollama request body I was using earlier:
req := map[string]any{
    "model":     llmConfig.Model,
    "stream":    true,
    "messages": []map[string]string{
        {"role": "user", "content": basePrompt + prompt},  // ← Everything recomputed!
    },
    "options": map[string]float64{
        "temperature": llmConfig.Temperature,
        "top_p":       llmConfig.TopP,
    },
}
In this setup, multiple requests shared the same basePrompt. However, because the entire prompt was sent as one message every time, the cache couldn’t be reused properly. As a result, the model recomputed everything for each request.
To fix this, I separated the basePrompt into its own message so it can be cached independently:
req := map[string]any{
    "model":     llmConfig.Model,
    "stream":    true,
    "messages": []map[string]any{
        {"role": "system", "content": basePrompt},  // ← Cached across jobs!
        {"role": "user",  "content": prompt},       // Only this changes
    },
    "options": map[string]float64{
        "temperature": llmConfig.Temperature,
        "top_p":       llmConfig.TopP,
    },
}
With this structure:
- The first request computes everything and fills the cache
- Subsequent requests reuse the cached basePrompt
- The model only focuses on the new, job-specific prompt
This significantly reduces repeated computation and improves throughput when running many similar requests.
A practical way to measure performance and choose a model
Different models are designed for different use cases. If a model feels slow or doesn’t suit your workload, it’s a good idea to compare it with others instead of guessing.
Ollama makes this easy with the --verbose flag, which shows detailed timing and performance stats for each run.
For example, here’s a simple Hello World request run with --verbose:
ollama run gemma2:2b "Hello World" --verbose
Hello to you too! 👋  How can I help you today? 😄


total duration:       5.564087708s
load duration:        4.478411408s
prompt eval count:    11 token(s)
prompt eval duration: 391.177149ms
prompt eval rate:     28.12 tokens/s
eval count:           18 token(s)
eval duration:        610.898556ms
eval rate:            29.46 tokens/s
Let’s break down what each of these lines means, so you can do the comparisons effectively.
- total duration
The total time taken for the entire request, from start to finish. This includes loading the model and generating the response. - load duration
The time spent loading the model into memory. This is usually slow only on the first run. Subsequent runs are much faster if the model stays loaded. - prompt eval count
The number of tokens in your input prompt. - prompt eval duration
How long the model took to process your input prompt before it started generating output. - prompt eval rate
How fast the prompt was processed, measured in tokens per second. This mainly depends on model size and hardware. - eval count
The number of tokens generated as output. - eval duration
How long it took to generate the output tokens. - eval rate
The most important number for day-to-day usage. This tells you how fast the model is generating tokens (tokens per second).
Why comparing models like this helps
If you run the same prompt across different models using --verbose, you can directly compare:
- Load time (important if models reload often)
- Prompt processing speed
- Token generation speed (tokens/sec)
Another Tip: Dont just compare "Hello World", compare it with your exact use case and see which one performs best in your system.
Wrapping up
I hope you picked up a few useful debugging techniques and fixes to deal with Ollama speed issues. These are all based on my real experiences. I ran into these problems myself, worked through them step by step, and eventually got the results I needed.
We introduced Ollama into our workflow to solve a bulk-processing LLM problem while working on FreeDevtools, a platform that provides over 125k free developer resources. To streamline the workflow, we are building a CLI tool called dprompts, which helps teams distribute large batches of LLM tasks across developers’ local machines and aggregate the results in a database. This approach removes the dependency on paid cloud LLMs and eliminates concerns about cost, quotas, and rate limits.
You can learn more about dprompts and how to set it up by visiting the project’s GitHub repository and checking the README.
You can also check out our other article on local LLMs if you want to learn more about local LLMs in general.


