DevTools in the Pipeline: How to Keep Your Website Snappy, Lean, and Beautiful


The Quality Monitoring Problem
Websites (or apps) start just fine: they are fast, lightweight, and have good aesthetics. Over time though, they degrade: the website becomes slow and bulky, and the design goes off the rails. Degradation often stems from haphazard features, plugins, and content accumulation.
Degradation is almost unnoticeable on a day-to-day basis, however, it accumulates into a huge mess over longer periods of time. The problem is compounded due to changing teams, lack of context among contributors, and lack of quality monitoring over time. The accumulation of these problems can lead to a frustrating cycle of issues and a diminished user experience.
Continuous Quality Monitoring
The root cause of degradation is the lack of regular maintenance. Teams may not be sufficiently paying attention to:
- Identifying degradation issues (performance, size, aesthetics) on a day-to-day basis
- Finding root causes
- Solving the underlying issues
- Deploying and distributing the improved products
The key step to maintaining or improving quality is the day-to-day identification of minor degradation. The worst way to go about doing this is by depending on people's good intentions alone. Due to time pressures and lack of energy, there is a high probability that people ignore day-to-day minor degradation. One of the better ways to improve awareness is through enforcing quality monitoring in the deployment pipelines.
Therefore, Continuous Quality Monitoring (CQM) is both a mindset and system to enhance website speed, efficiency and aesthetic on a day-to-day basis. One can think of these two components as follows:
Mindset: Always convert vaguely defined quality goals into clear and precise definitions for practical checks. For example, if the vaguely defined goal is: "Make website harmonious and colourful", the CQM mindset is to translate that into: "This is our colour palette, which consists of colours A, B, and C; every other colour, we reject".
System: Implement a mechanism which automatically detects and rejects violations of the aforementioned checks. This automated process continuously monitors and blocks any deviations from the desired website properties.
Chrome Devtools in Pipeline
One can use Chrome DevTools, Firefox DevTools, and Lightproxy to check performance issues, design errors, and code coverage of our web pages. In short, continuous monitoring happens through metrics in CI/CD.
Chrome DevTools has protocols such as Lighthouse, Coverage, and CSS Protocols for inspecting and monitoring performance, unused code and aesthetics. We aim to use these protocols programmatically in our node project for Continous Quality Monitoring.
Lighthouse CI for Performance Monitoring
Lighthouse CI is an open-source, automated tool for improving the quality of web pages. We can run it against any web page, public or requiring authentication. It has audits for performance, accessibility, progressive web apps, SEO, and more.
Install Lighthouse CI
First, we installed the lighthouse CI package in our node project using the command:
npm install -g @lhci/cli@0.12.x
Note: Chrome browser/chromium is required on the machine.
Configure the Lighthouse CI
Created a config file called lighthouserc.js in the root of the project for controlling the lighthouse CI. The configuration is:
module.exports = {
    ci: {
      collect: {
        settings: {chromeFlags: '--no-sandbox'},
        staticDistDir: 'public/',
      },
      upload: {
        target: 'temporary-public-storage',
      },
    },
  };
staticDistDir is given as public/ directory for retrieving the performance score for all HTML pages defined in the public directory.
Find further configuration details for Lighthouse CI.
Local Testing
lhci command can be used for testing the Lighthouse CI locally:
lhci autorun \
--upload.target=temporary-public-storage \
--collect.settings.chromeFlags="--no-sandbox"
Configure the CI Provider
In our team, we mainly use Gitlab CI, In production, we run the project in a docker container for providing an isolated environment. The configuration in our Dockerfile is:
FROM node:18-bullseye-slim

WORKDIR /app

ENV PATH /app/node_modules/.bin:$PATH

RUN apt-get update && apt-get install -y \
    chromium \
    chromium-driver

COPY ./package.json  /app
COPY . .

RUN npm install

# RUN npm install --global yarn
RUN npm run build

EXPOSE 3000
Additionally installed the chromium and chromium driver for the smooth functioning of Lighthouse CI.
For CI configuration created a separate job in .gitlab-cl.yml file:
performance-measuring:
  stage: performance-measuring
  image: $TAG_LATEST
  script:
    - cd /app
    - npm install -g @lhci/cli@0.12.x
    - lhci autorun --upload.target=temporary-public-storage --collect.settings.chromeFlags="--no-sandbox" || echo "LHCI failed!"
Find further details for integrating with other CI providers such as GitHub Actions, Travis CI etc.
Report Generation
After running the pipeline successfully, The reports are uploaded to the reports being stored on GCP Cloud Storage temporarily. Alternatives are available to store the report in the local file system.
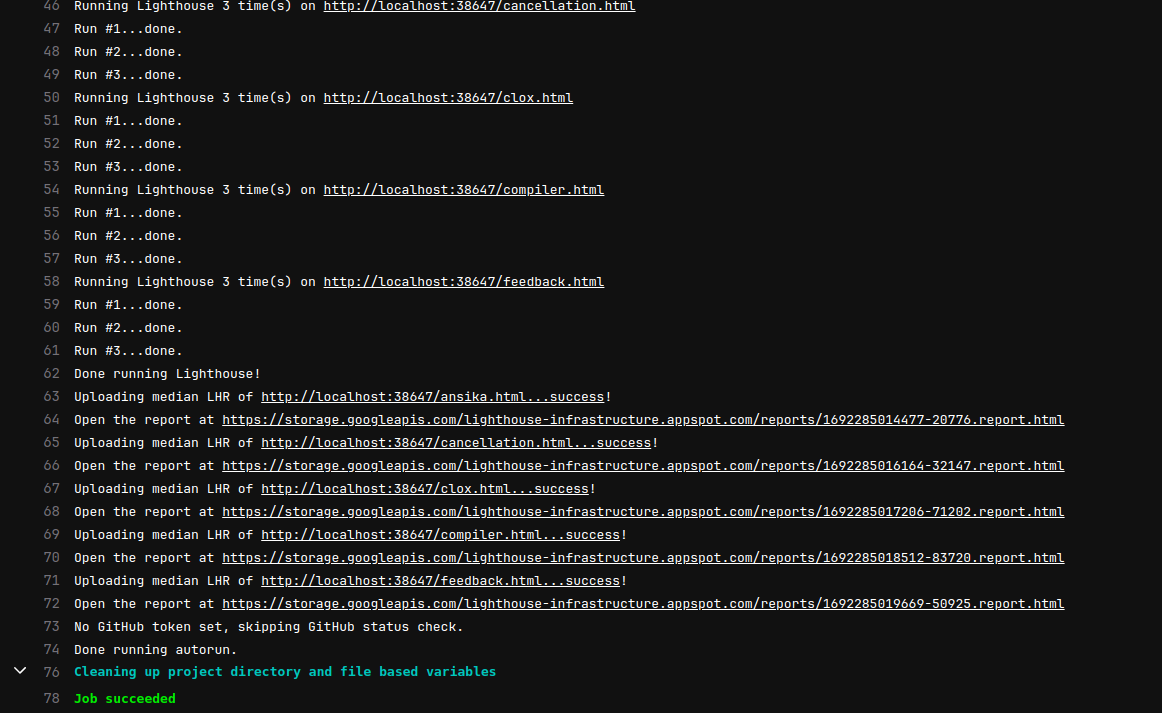
The Lighthouse performance report will look like this:
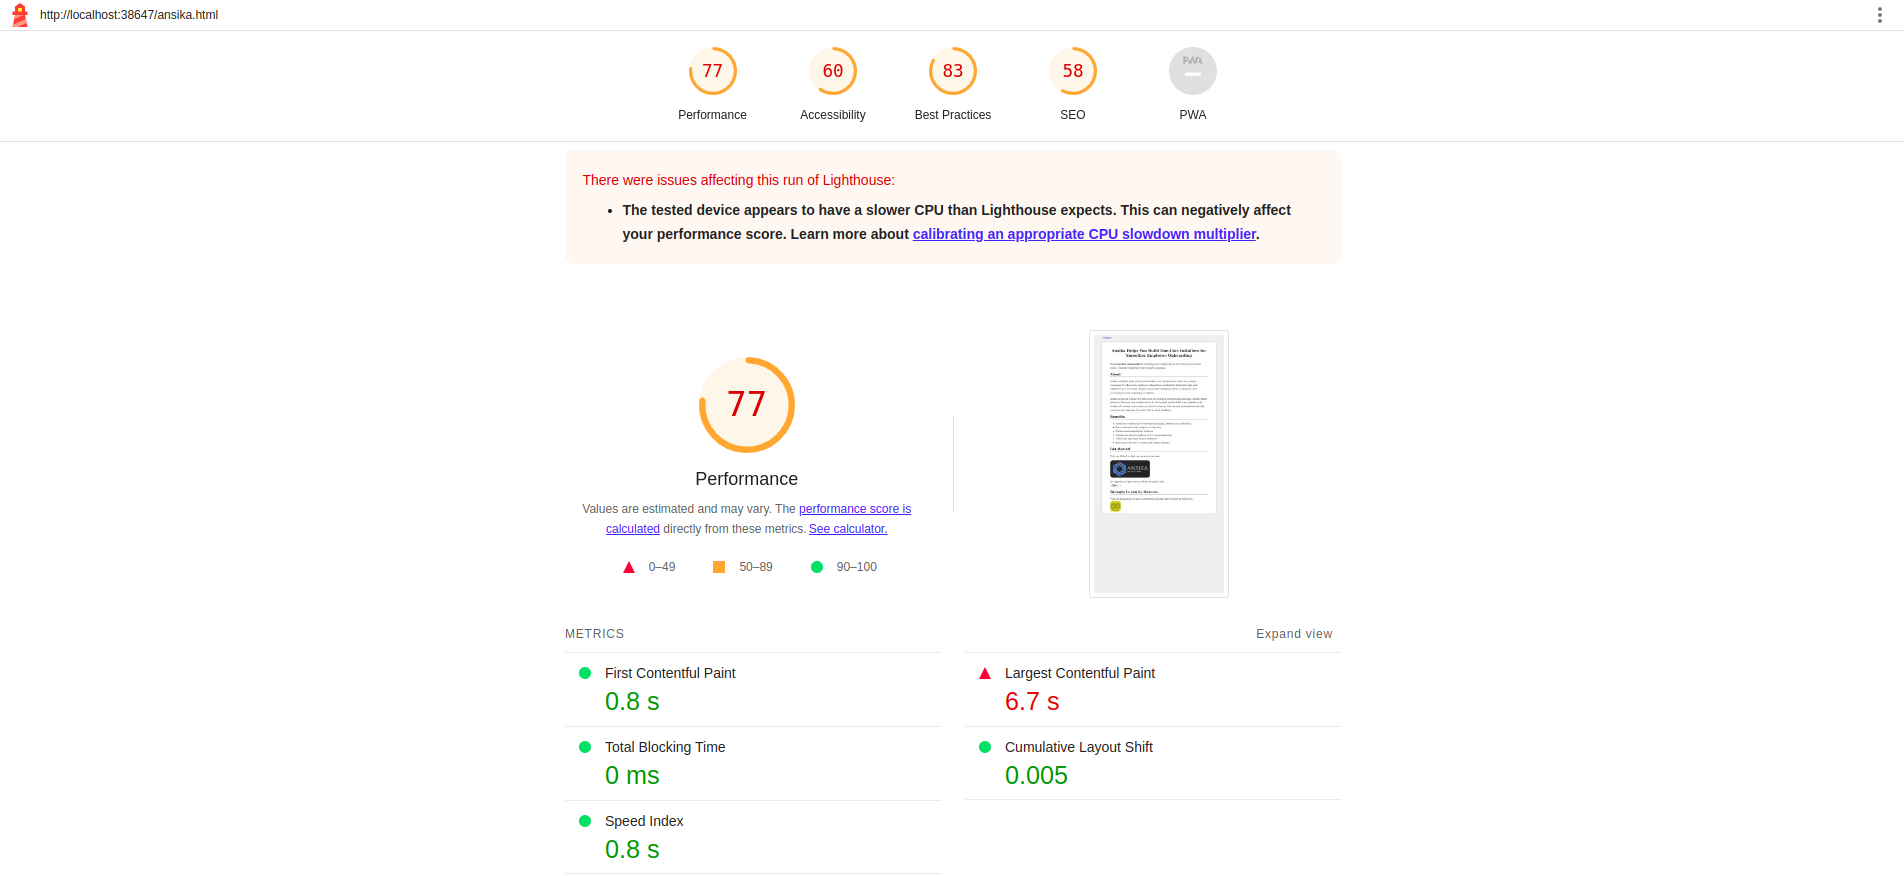
Reject Violations
For maintaining a higher standard for performance we need to set up some rules. For example, if the performance score goes below 90 (0.9), break the pipeline and resume further steps only after fixing the issue. Similar to the HTML report the Lighthouse CI will generate a JSON report.
   "first-contentful-paint": {
      "id": "first-contentful-paint",
      "title": "First Contentful Paint",
      "description": "First Contentful Paint marks the time at which the first text or image is painted. [Learn more about the First Contentful Paint metric](https://developer.chrome.com/docs/lighthouse/performance/first-contentful-paint/).",
      "score": 0.99,
      "scoreDisplayMode": "numeric",
      "numericValue": 1134.6480000000001,
      "numericUnit": "millisecond",
      "displayValue": "1.1 s"
    },
    "largest-contentful-paint": {
      "id": "largest-contentful-paint",
      "title": "Largest Contentful Paint",
      "description": "Largest Contentful Paint marks the time at which the largest text or image is painted. [Learn more about the Largest Contentful Paint metric](https://developer.chrome.com/docs/lighthouse/performance/lighthouse-largest-contentful-paint/)",
      "score": 1,
      "scoreDisplayMode": "numeric",
      "numericValue": 1363.266,
      "numericUnit": "millisecond",
      "displayValue": "1.4 s"
    },
    "first-meaningful-paint": {
      "id": "first-meaningful-paint",
      "title": "First Meaningful Paint",
      "description": "First Meaningful Paint measures when the primary content of a page is visible. [Learn more about the First Meaningful Paint metric](https://developer.chrome.com/docs/lighthouse/performance/first-meaningful-paint/).",
      "score": 0.99,
      "scoreDisplayMode": "numeric",
      "numericValue": 1363.266,
      "numericUnit": "millisecond",
      "displayValue": "1.4 s"
    },
    "speed-index": {
      "id": "speed-index",
      "title": "Speed Index",
      "description": "Speed Index shows how quickly the contents of a page are visibly populated. [Learn more about the Speed Index metric](https://developer.chrome.com/docs/lighthouse/performance/speed-index/).",
      "score": 1,
      "scoreDisplayMode": "numeric",
      "numericValue": 1134.6480000000001,
      "numericUnit": "millisecond",
      "displayValue": "1.1 s"
    },
We can easily compare the defined standards and the lighthouse score obtained from the pipeline. If any of the scores are below the defined standard, the CI job will fail forcefully.
Puppeteer for Removing Unused Code
Puppeteer is a Node.js library which provides a high-level API to control Chrome/Chromium over the DevTools Protocol. Puppeteer runs in headless mode by default, but can be configured to run in full ("headful") Chrome/Chromium.
Chrome DevTool's coverage protocol will provide detailed information about the used and unused CSS and JS code in the project.
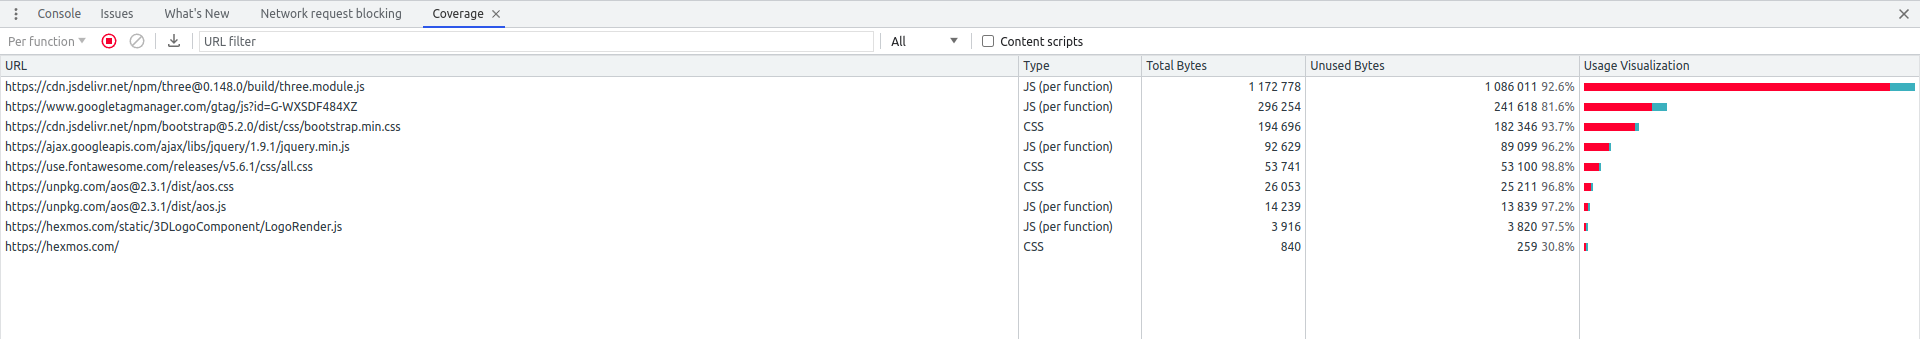
We are trying to get these details programmatically in the CI using the Puppeteer library.
Install Puppeteer
Installed the Puppeteer library in the project:
npm i puppeteer
Code Coverage function
Created a javascript function that uses the puppeteer library for calculating the used and unused code in bytes.
//import the puppeteer library
const puppeteer = require('puppeteer');
async function getCoverage() {
const browser = await puppeteer.launch();
const page = await browser.newPage();
//Add the url that need to test
const urlToTest = 'https://hexmos.com';
await page.goto(urlToTest);
// Enable coverage tracking
await Promise.all([
page.coverage.startJSCoverage(),
page.coverage.startCSSCoverage()
]);
// Run the tests
// Stop coverage tracking
const [jsCoverage, cssCoverage] = await Promise.all([
page.coverage.stopJSCoverage(),
page.coverage.stopCSSCoverage()
]);
// Calculate used and unused bytes for JavaScript files
const jsResults = [];
for (const entry of jsCoverage) {
let usedBytes = 0;
for (const range of entry.ranges) {
usedBytes += range.end - range.start + 1;
}
const unusedBytes = entry.text.length - usedBytes;
jsResults.push({ url: entry.url, usedBytes, unusedBytes });
}
// Calculate used and unused bytes for CSS files
const cssResults = [];
for (const entry of cssCoverage) {
let usedBytes = 0;
for (const range of entry.ranges) {
usedBytes += range.end - range.start + 1;
}
const unusedBytes = entry.text.length - usedBytes;
cssResults.push({ url: entry.url, usedBytes, unusedBytes });
}
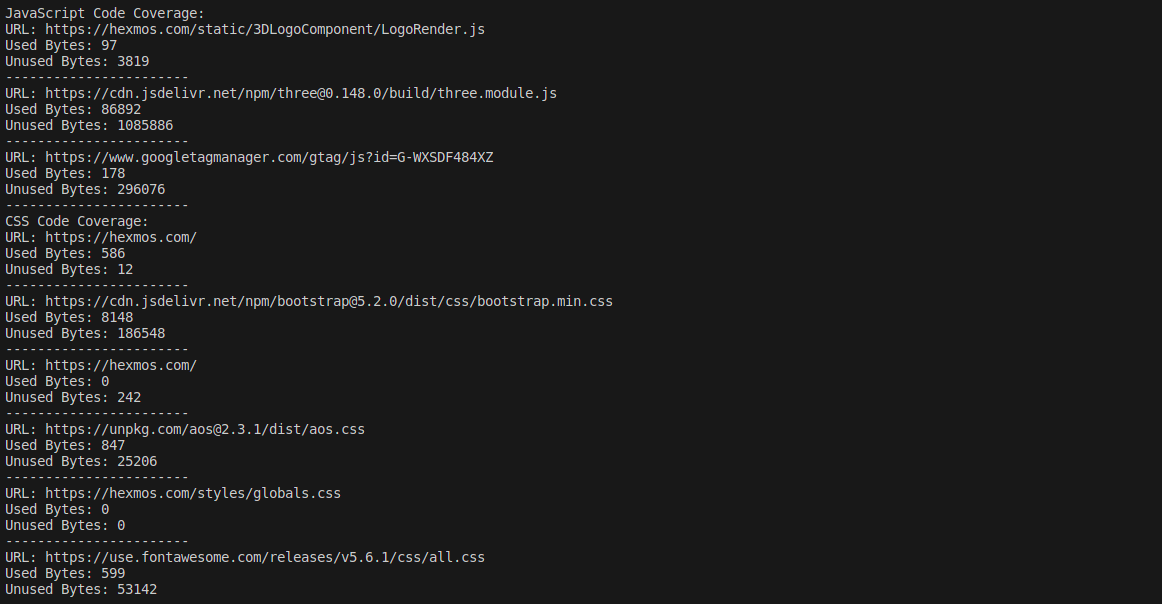
console.log('JavaScript Code Coverage:');
for (const result of jsResults) {
console.log(`URL: ${result.url}`);
console.log(`Used Bytes: ${result.usedBytes}`);
console.log(`Unused Bytes: ${result.unusedBytes}`);
console.log('-----------------------');
}
console.log('CSS Code Coverage:');
for (const result of cssResults) {
console.log(`URL: ${result.url}`);
console.log(`Used Bytes: ${result.usedBytes}`);
console.log(`Unused Bytes: ${result.unusedBytes}`);
console.log('-----------------------');
}
await browser.close();
}
getCoverage();
Local Testing
Directly run the js file using node for local testing:
node file_name.js
Configure the CI Provider
Created a separate job in .gitlab-ci.yml and added the script for running the js file inside the docker container.
code-coverage-measuring:
  stage: code-coverage-measuring
  image: $TAG_LATEST
  script:
    - node code_coverage.js #replace with your file.
Report Generation
Puppeteer will calculate and return the used and unused bytes for each resource in the terminal.
Reject Violations
Restricting the percentage of unused code will reduce the size of the project. We can calculate the percentage of unused code by:
% of unused code = (total unused byte/total used byte + total unused byte)*100
If the percentage of unused code exceeds 20% break the pipeline job. It will succeed only if the size of the unused code is below 20%.
Lighthouse and Puppeteer for Aesthetics
Monitoring Contrast Issues
Lighthouse CI can also be used for identifying the contrast, and readability issues in the web page. The report generated for performance monitoring also measures the score for contrast and readability-related issues.

Consistent Color Palette
Consistent Color Palettes in websites bring visual harmony, identity and professionalism. Violating colour consistency breaks design principles and leads to a bad user experience
Chrome DevTools has a feature called CSS Overview which helps to monitor the different colours used in the web pages.
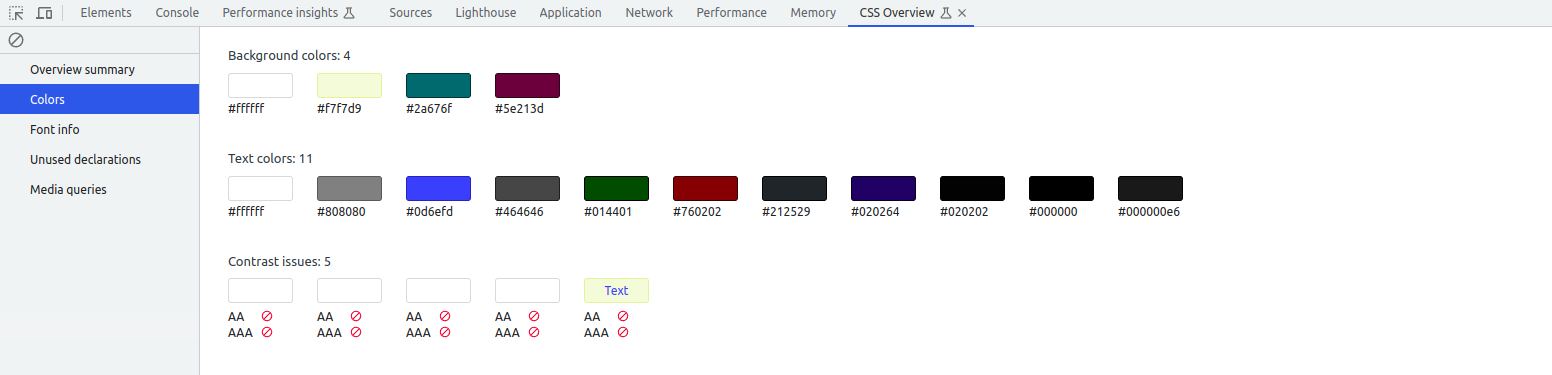
We are trying to get a similar colour extraction in the CI, The purpose is need to make sure none of the developers deviated from the colour palette consistency.
Puppeteer provides a way to identify the colours used in the webpage programmatically.
Colour Extraction
Created a function that extracts all the text and background colours used in the webpage using the puppeteer library.
//import the puppeteer library
const puppeteer = require('puppeteer');
(async () => {
const browser = await puppeteer.launch();
const page = await browser.newPage();
// Replace with webpage name
await page.goto('https://hexmos.com');
// Function to convert RGB color string to hexadecimal
const rgbToHex = (rgb) => {
const [r, g, b] = rgb.match(/\d+/g);
return `#${Number(r).toString(16).padStart(2, '0')}${Number(g).toString(16).padStart(2, '0')}${Number(b).toString(16).padStart(2, '0')}`;
};
// Function to extract unique colors used in a website
const extractColors = async () => {
const allElements = await page.$$('*');
const uniqueColors = new Set();
for (const element of allElements) {
const computedStyles = await element.evaluate(el => {
const styles = getComputedStyle(el);
return {
color: styles.color,
backgroundColor: styles.backgroundColor,
// Add more properties as needed
};
});
uniqueColors.add(rgbToHex(computedStyles.color));
uniqueColors.add(rgbToHex(computedStyles.backgroundColor));
}
return Array.from(uniqueColors);
};
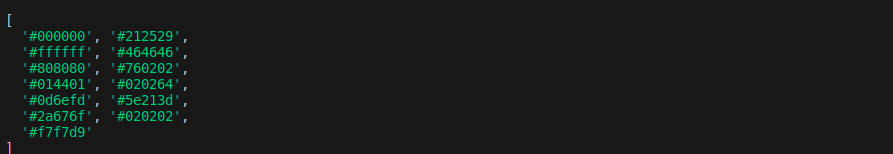
const colorsUsed = await extractColors();
console.log(colorsUsed);
await browser.close();
})();
Local Testing
Run the above Javascript File in the local system:
node file_name.js
Configure the CI Provider
A separate job is defined in .gitlab-ci.yml for the colour extraction and check.
color-palette-check:
  stage: color-palette-check
  image: $TAG_LATEST
  script:
    - node color_palette.js #replace with your file.
Report Generation
Puppeteer will calculate and return the text and background colours used on the webpage.
Violation Rejection
Colours are one of the important aspects of maintaining good aesthetics. Cross-checking the colours extracted by the puppeteer and the specified colour palette of the webpage will help to identify violations of this rule. Only after fixing the issue can one proceed to the next steps in the pipeline
Conclusion
Continuous Quality Monitoring ensures that performance, size, and aesthetics meet a consistent standard on a day-to-day basis. CQM helps to identify the issues early and reduce the degradation and make your website fast, lightweight and maintain good aesthetics.

![]()
Hacker News Post