Hacking Gitlab: How We Supercharged Coverage Reports with Greasemonkey


Continuously Increasing Code Coverage as a Team
At Hexmos, our team is continually improving our application, Hexmos Feedback. Hexmos Feedback tailors to meet the needs of employees who value regular, meaningful feedback, empowering the team to effortlessly stay motivated.
A significant challenge in our software is that certain features occasionally experience unexpected issues after deployment. The issue drains the team of lots of energy and time, in terms of debugging, finding root cause and applying fixes.
To tackle the issue we started writing test cases using selenium for each feature in Feedback. We included a condition that allows deploying the new features once the test cases pass successfully.
Coverage Growth Enforcement Problem
The introduction of testing reduces the unexpected breakage of features and gives us relief. But we didn't stop there, our next goal was to pass the whole source code through testing and make sure none of the pieces broke.
How to make sure all the source code is exercised through testing? How to measure it?
We started thinking of consistently making our team aware of code coverage metrics.
Code coverage is commonly used to measure how much of the source code of a program executes when a particular test suite runs.
An increase in the percentage of code coverage means we cover more of our source code under testing.
Currently, our code coverage stands at 26%, which falls short of ensuring comprehensive testing and stability. This is why we have set our modest goal to achieve 80% code coverage. To accomplish this, we came up with a rule: in every merge request, the code coverage should either increase or remain unchanged; it should never decrease.
Limitations of Coverage Comparison in GitLab
Keeping the goal in mind we started integrating code coverage into Gitlab, the place where we push our code.
It's important to know that "code coverage" isn't a single number - there are different types of code coverage metrics that are useful to know.
- Statement coverage tells us if every line of code ran at least once during testing. But it doesn't guarantee testing covers all logical paths.
- Branch coverage evaluates all conditional branches, like if/else blocks, in both ways. This helps validate more of our program's logic.
- Line coverage shows what percentage of lines ran during tests. However, two functions could have the same line coverage while testing very different code blocks.
- Function coverage confirms testing called every function at least once. But functions may complete without hitting all their lines of code.
Unfortunately, GitLab only displays a single code coverage value, we can't differentiate the various types of code coverage.

Solution: GreaseMonkey + Anybadge
To tackle the issue we came up with a solution using Greasemonkey and Gitlab badges.
Greasemonkey is a user script manager made available as a browser extension. It enables users to install scripts that make changes to webpage content when the browser loads the page. We used Greasemonkey in our team earlier, for creating some mini tools to aid us in our daily tasks. So we decided to use Greasemonkey, as it can add our custom-made script to display detailed code coverage information.
Tampermonkey, on the other hand, is another user script manager extension. Similar to Greasemonkey, it empowers users to install and manage scripts that can manipulate web page content. Tampermonkey offers additional functionalities and flexibility, making it suitable for more complex scripting needs.
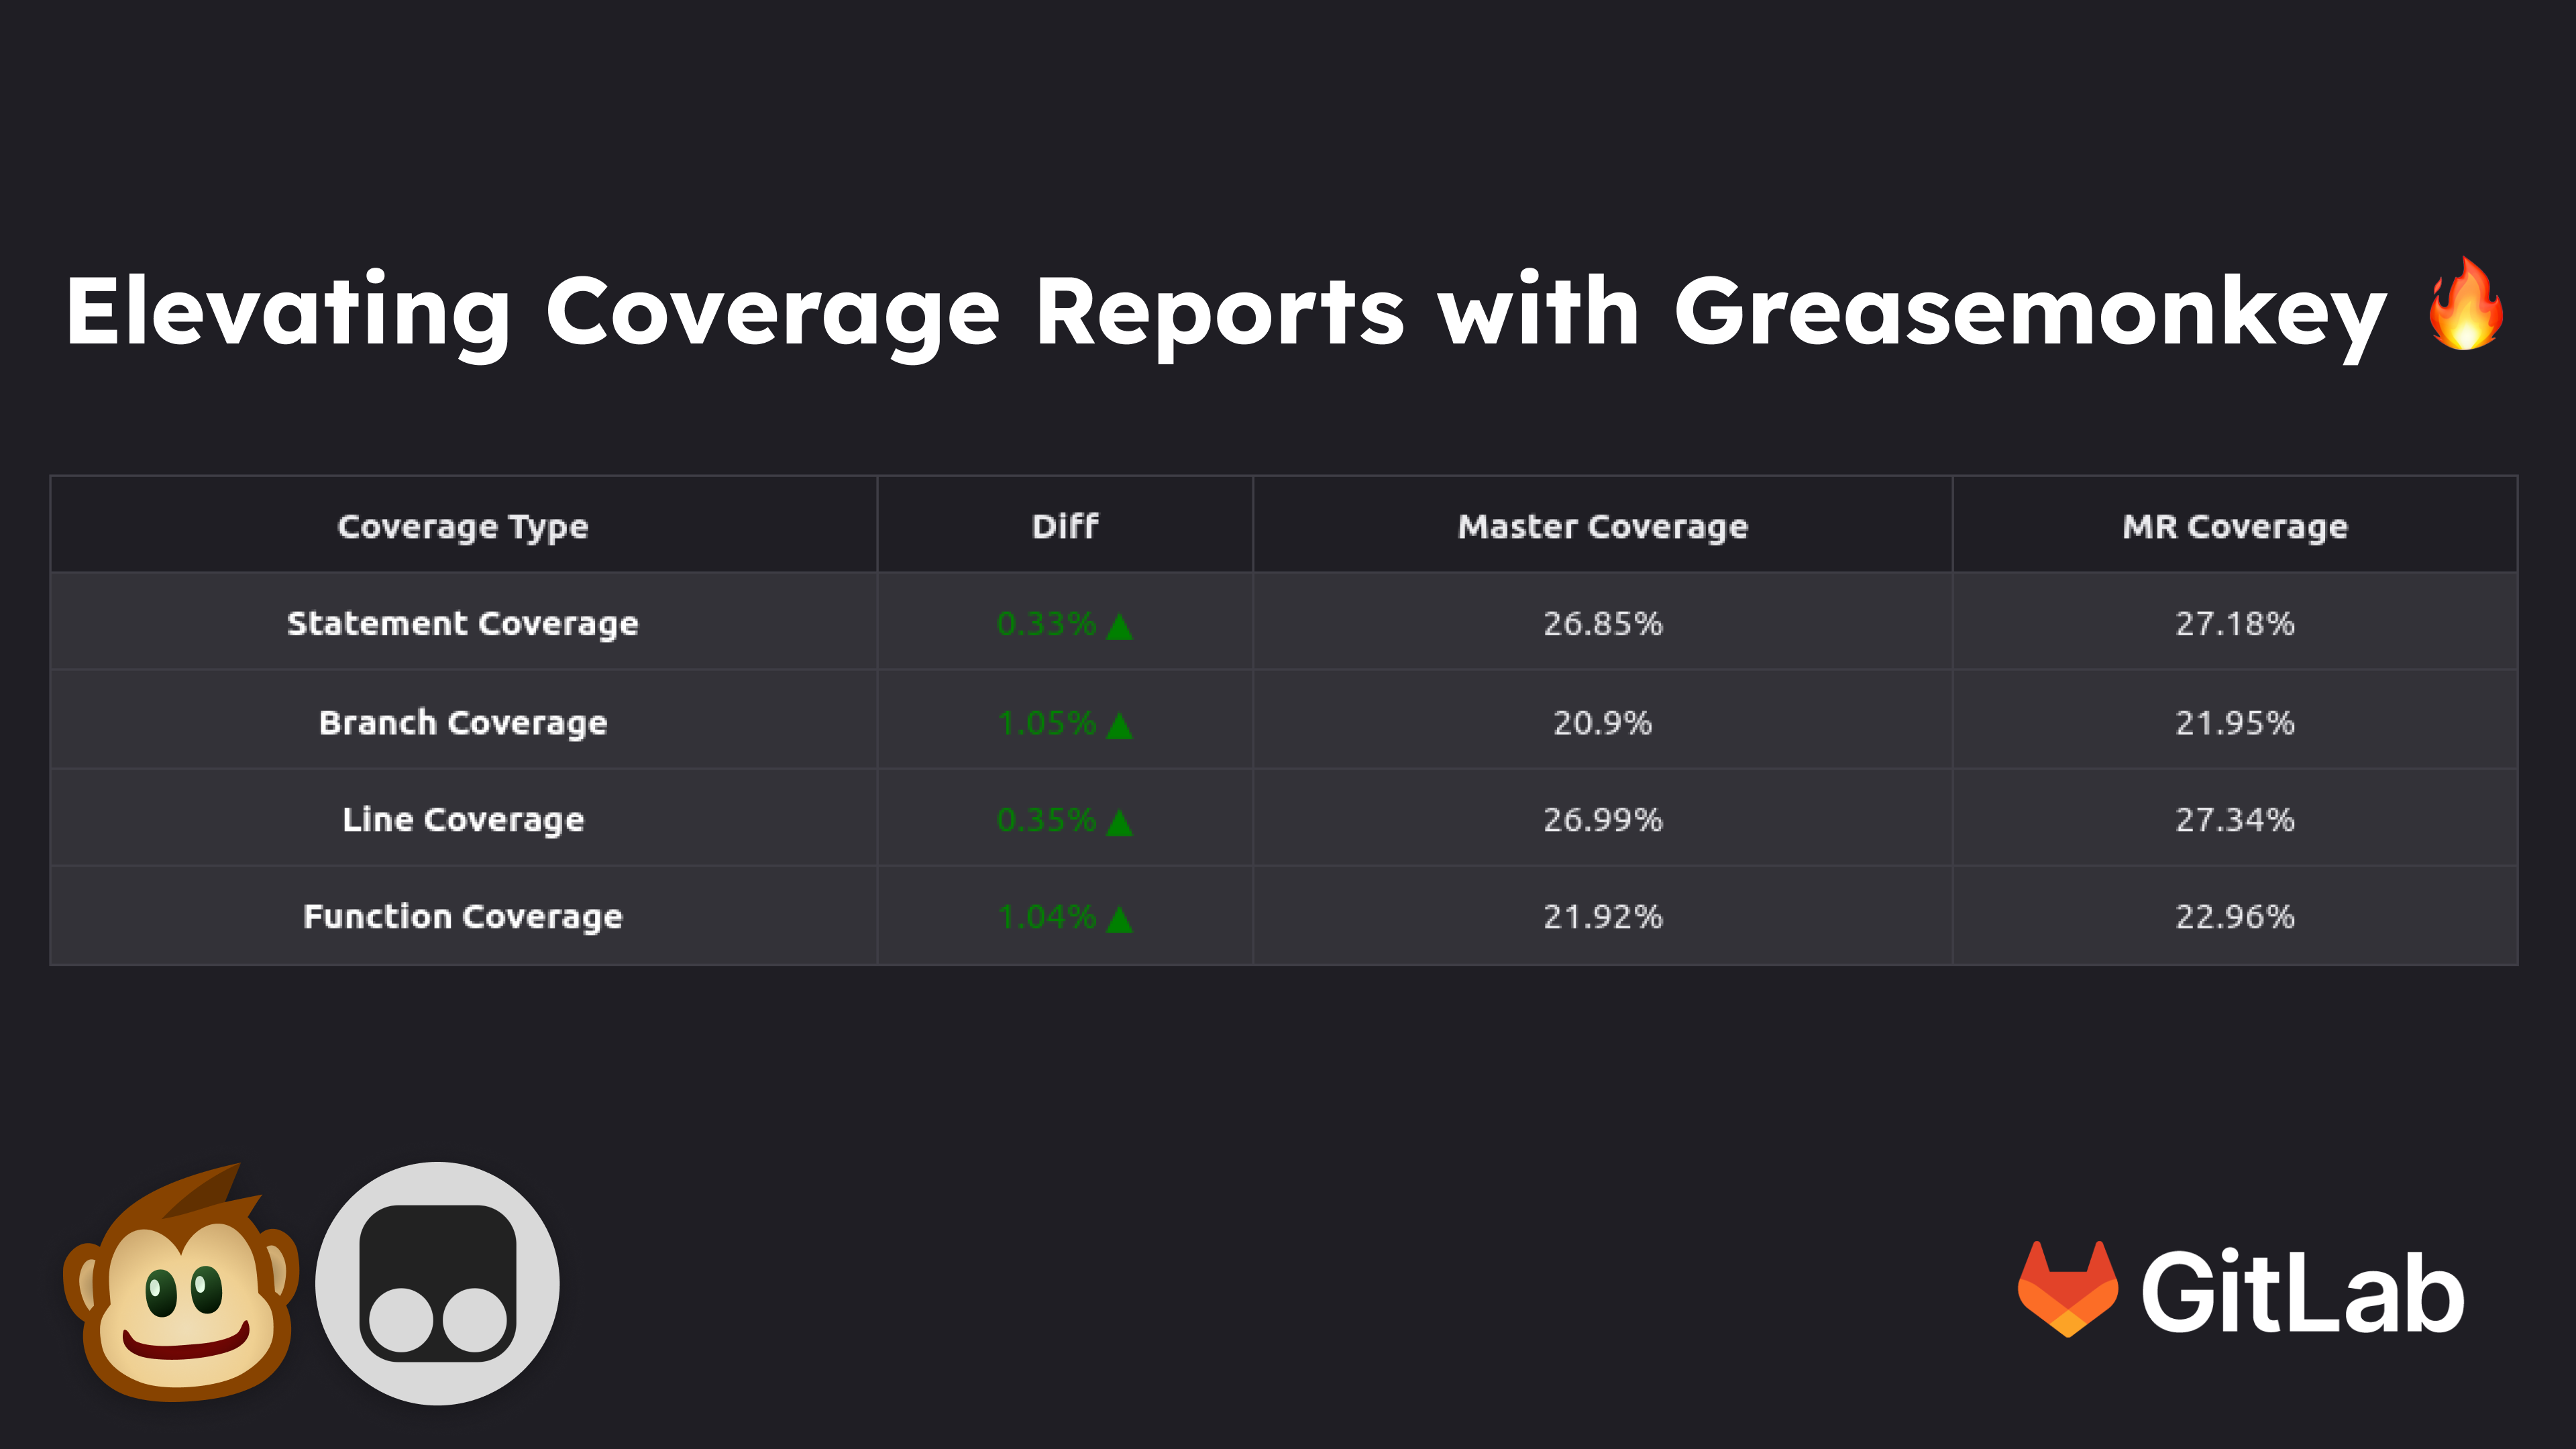
The below image is the result of displaying different Code coverage values in Gitlab using Greasemonkey.

Another feature we need in GitLab is showing the different code coverage values on the repository landing page. By default, Gitlab only shows a single code coverage value. But we achieved displaying each section code coverage values using Gitlab badges.

Implementing the Coverage in Detail
Here we will be demonstrating in detail how we have implemented such a system to implement coverage and encourage coverage growth as a team.
Setting up Coverage in a React Project
In our example, we will configure a React project to generate code coverage reports.
To get a coverage report, first we need to instrument the code.
Instrumentation tells us which parts of the code gets executed during the program's runtime.
For instrumenting our code we will use Cypress instrument-cra
To set it up, do the following
yarn add @cypress/instrument-cra
Modify your npm script in package.json by adding instrument
{
  "scripts": {
    "instrument": "react-scripts -r @cypress/instrument-cra start"
  }
}
We have now set up Instrumentation. npm instrument will instrument your code every time you start the server.
Now to view the coverage report you will have to use a tool called istanbul
-
You can install istanbul by
npm install --save-dev nyc -
Istanbul provides the
nyccommand, which we will use for viewing the coverage report.
We will be doing the following steps to get the coverage
-
We will launch the browser via the testcase
-
Perform the tests
-
Get the coverage information by printing
console.log(JSON.stringify(window.__coverage__))
-
The coverage information we can write to a file and store it in .nyc_report folder
-
After doing the steps you can simply do the following commands
To get the full report
npx -y nyc report

To get the summary
npx nyc report --reporter=text-summary

To get the report in an html file
npx nyc report --reporter=html
The html file is located at coverages/index.html

In the following code snippet, we have implemented the logic in selenium python, in pytests teardown function
def tearDown(self):
    r = self.driver.execute_script("return window.__coverage__")
    with open(f".nyc_output/coverage_{self.test_case_name}.json", "w") as f:
        f.write(json.dumps(r))
The above script will write the contents of the coverage to a JSON file in .nyc_output
At the end, the folder structure will now look like below

The nyc commands will fetch the data from .nyc_output folder by default.
Generating Badges from the Coverage Report
We can display badges with more detailed information like line coverage, branch coverage etc.
We will use a tool called anybadge, to generate the badges with our desired metric
You can send these custom badges as artifacts.
The following script can show you how to do it.
import anybadge

import json

def extract_coverage_summary(coverage_summary):

   lines = coverage_summary.strip().split("\n")

   lenlines = len(lines)

   lines = lines[1 : lenlines - 1]

   data = {}

 for line in lines:

       key, value = line.split(":")

       key = key.strip()

       value = float(value[0 : value.find("%")])

       data[key] = value

 return data

def create_badge(metric, value):

   thresholds = {50: "red", 60: "orange", 70: "yellow", 80: "green"}

   badge = anybadge.Badge(metric, value, thresholds=thresholds)

   badge.write_badge(f"testcases/coverage-badges/{metric}_badge.svg")

def generate_coverage_badges(report_output):

 extract_coverage_summary(report_output)

   coverage_summary = extract_coverage_summary(report_output)

 create_badge("Statement_Coverage", coverage_summary["Statements"])

 create_badge("Branch_Coverage", coverage_summary["Branches"])

 create_badge("Function_Coverage", coverage_summary["Functions"])

 create_badge("Line_Coverage", coverage_summary["Lines"])

 with open("testcases/coverage-badges/coverage_summary.json", "w") as json_file:

       json.dump(coverage_summary, json_file, indent=4)
The above script creates 4 badges as well as a JSON file for storing coverage information
We will be using the above JSON file for the coverage comparison tool in the next section.
We have placed these files in an artifact directory.
In gitlab-ci.yml, We have set the artifacts like so in our test stage.
test:

 stage: test

 only:

   - master

 image: $TAG_LATEST

 script:

 artifacts:

   paths:

     - testcases/coverage-badges
The above script sets the directory for the artifacts to "testcases/coverage-badges."
To add these badges to your project
-
Open GitLab
-
Go to settings
-
Go to the badges section
-
Add the badge with the URL of the following form
-
https://git.apps.hexmos.com/api/v4/projects/%{project_id}/jobs/artifacts/master/raw/testcases/coverage-badges/Branch_Coverage_badge.svg?job=test

Greasemonkey to Enhance Coverage Comparison
Now, since we have all the data and the badges set up, we can use Greasemonkey to render a table comparing both the master branch and MR branch coverages.
The Greasemonkey script fetches the data for the table from the coverage.json file we generated earlier.
{
  "Statements": 76.51,

  "Branches": 70.55,

  "Functions": 71.92,

  "Lines": 76.63
}
Find the Greasemonkey script at GreasyFork
Conclusion
The Greasemonkey script we have developed demonstrates an effective way to integrate additional testing metrics into code reviews on GitLab. By leveraging job artifacts to store coverage data, it can dynamically display coverage comparisons without needing any changes to GitLab itself.
The side-by-side table view provides reviewers an easy way to check that code merges have not negatively impacted code coverage. This helps enforce coverage as a quality criterion during the code review process.
In addition, we implemented a script into the test suite that generates badges from the coverage reports to display the metrics prominently on the project's home page. This gives an at-a-glance indication of test quality for anyone visiting the project.
By taking advantage of browser scripts and existing GitLab APIs/features, this approach allows for minimal effort implementation for any project already collecting coverage reports as artifacts. The script handles all the data fetching and presentation automatically on page load.
Overall, we have shown how developers can factor code coverage and other testing metrics directly into merge request workflows, even when the platform may not support such integrations. With some enhancements, developers can generalize this technique to other version control hosting services like GitHub as well.
Hacker News Post
Hacking Gitlab: How We Supercharged Coverage Reports with Greasemonkey
Linkedin Post
Hacking Gitlab: How We Supercharged Coverage Reports with Greasemonkey